


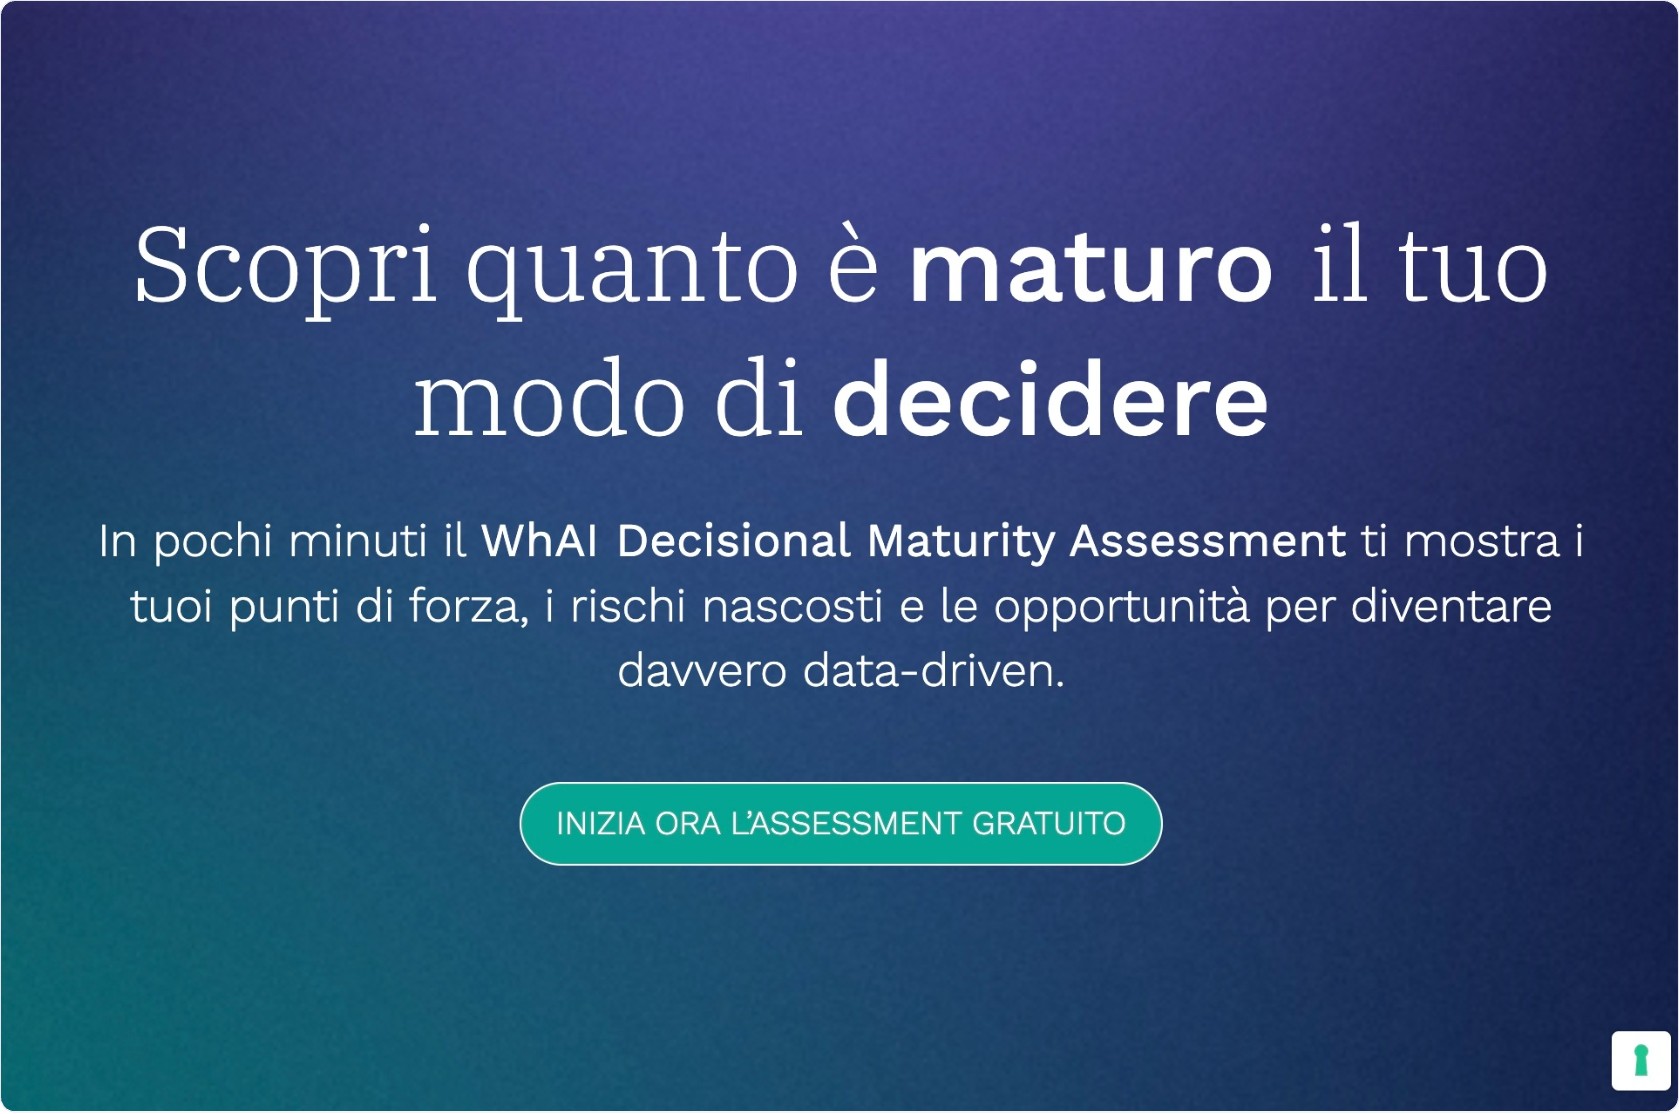
ASSESSMENT
WhAI is the operating system for AI-first companies.
A Decision Intelligence platform that integrates people, processes, and AI into a single organizational model.
Don’t think of AI as just a tool
Don’t think of AI as just a tool
Most companies already use AI, but only a few manage to maximize its value.
It’s about understanding where to invest, when to act, and how to generate real results. WhAI makes this possible.


WhAI is the operating system for AI-first companies.
A Decision Intelligence platform that integrates people, processes, and AI into a single organizational model.
People no longer work in silos.
They have greater context and clarity, allowing them to focus on higher-value activities.

They don’t depend on who manages them.
They are structured and evolving. They trigger decisions when needed, not just in meetings.

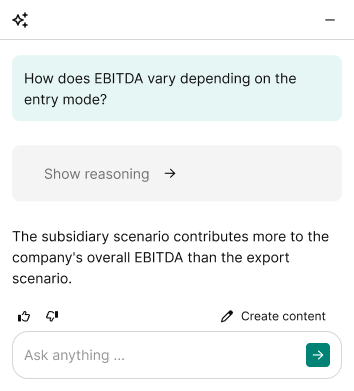
It’s not just a tool. It becomes part of the workflow, embedded in processes and decisions.
It supports both decision-making and execution.

.png)
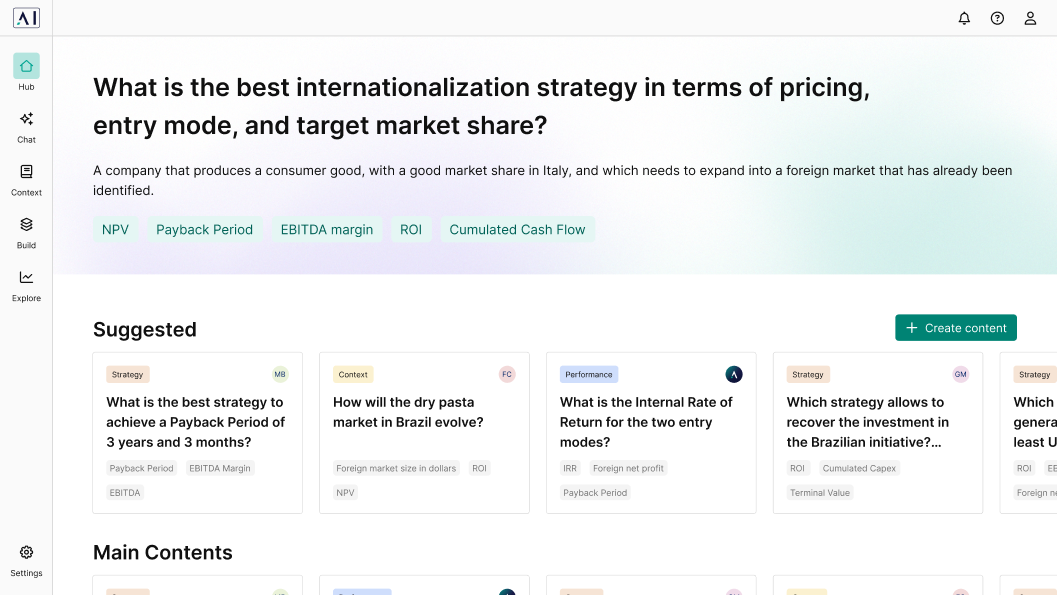
WhAI isn't for everyone. It's for those who want to make better decisions.
Are you driving the business or just explaining it after the fact?
Your models come in after the decision is already made. By the time you review the variance, the issue has already hit.
WhAI plugs operational data into your financial workflows, keeps projections up to date, and shows you where to act before deviations turn into real problems.
Are you closing deals or quietly giving away margin?
A discount pushed too far, a cost left out, a deal priced wrong. You only see the impact when the quarter closes.
WhAI brings economic discipline into every deal, analyzes offers in real time, and guides reps on what they can give and what they should not.

Are you investing where it works or where you always have?
Budget gets spread across initiatives without a clear view of what will perform. By the time you spot what is underperforming, the spend is already gone.
WhAI tracks performance as it happens, compares alternatives, and helps you reallocate budget while it still makes a difference.
Are you producing more or producing what actually drives value?
You run the plan, not the optimal mix. Bottlenecks show up only when it is too late to adjust.
WhAI connects operational data and constraints, optimizes production decisions, and keeps plans aligned with demand, costs, and capacity.
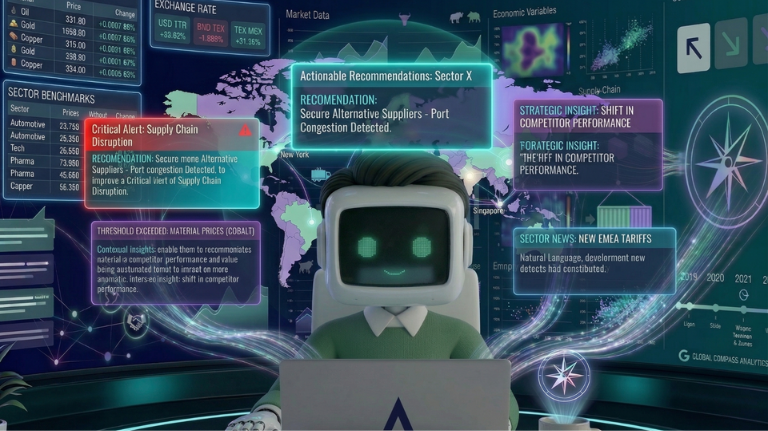
Are you reacting to price changes or staying ahead of them?
Costs move before you have time to respond. You end up buying when needed, at whatever the market gives you.
WhAI monitors market signals and suppliers, analyzes cost scenarios, and guides you on when to buy, hedge, or renegotiate.

Are you managing people or managing the cost of losing them?
Turnover, underutilization, overloaded teams. The impact shows up in the P&L before you can react.
WhAI connects workforce structure, costs, and productivity, tracks turnover dynamics, and helps you optimize before it becomes an operational issue.
Are you choosing where to invest or placing a bet?
Options get presented, but not truly tested. Risk only becomes clear after capital is committed.
WhAI simulates strategic scenarios, quantifies impact and downside, and lets you compare options before making irreversible decisions.
How to set the optimal price to maximize revenue or occupancy?
With current tools, it is difficult to analyze sales data in real time and adjust pricing to reflect changes in demand.
WhAI analyses sales, demand and external drivers, running real-time simulations to always suggest the most profitable price.
With WhAI, your decisions are always secure


Piazza Vetra 17, 20123 Milano (MI)C.F. / P. IVA 11257890969Num. Iscr. REA MI-2590124 Cap. Soc. 1.311.120,00€ i.v.PEC: vedraispa@legalmail.it
.png)